

For 2026 planning, this historical four-school snapshot has a pooled acceptance rate of 4.37%, ranging from Harvard’s 3.59% to Brown’s 5.36%. These benchmarks cover initial admission offers for the Class of 2028, not admission decisions issued in 2026; use them to assess selectivity, not predict your personal chances.
- Ivy league acceptance rate benchmarks 2026: this historical four-school snapshot ranges from 3.59% to 5.36%.
- Harvard has the lowest rate in this comparison; Brown has the highest. Neither is a safety school.
- The pooled 4.37% rate measures applications and offers, not individual applicants’ admission probabilities.
- Ivy Central’s personalized admissions counseling suits families seeking individual application strategy, not an admission guarantee.
Why this matters
An acceptance rate tells you how selective an applicant pool was. It does not tell you whether your academic preparation, subject interests or application will meet a university’s expectations.
For families applying from India, start with the Ivy League admissions guide for Indian students alongside the benchmarks below. Build your list around academic fit and affordability before comparing small differences in admission rates.
Ivy League acceptance rate benchmarks for 2026 planning
Acceptance rate means admission offers divided by applications received. Across the four schools below, the application-weighted overall rate was 4.37%, based on 8,391 offers from 192,028 applications.
| University | Applications | Initial admission offers | Acceptance rate | Reporting scope |
|---|---|---|---|---|
| Harvard | 54,008 | 1,937 | 3.59% | Class of 2028, combined admission rounds |
| Yale | 57,465 | 2,146 | 3.73% | Class of 2028, combined admission rounds |
| Brown | 48,898 | 2,623 | 5.36% | Class of 2028, combined admission rounds |
| Dartmouth | 31,657 | 1,685 | 5.32% | Class of 2028, combined admission rounds |
| Overall: four-school snapshot | 192,028 | 8,391 | 4.37% | Application-weighted pooled rate |
Brown had the highest acceptance rate in this comparison at 5.36%; Harvard had the lowest at 3.59%. Dartmouth’s 5.32% and Yale’s 3.73% sit between them. The highest rate still represents a highly selective applicant pool, not an easier route to admission.
Methodology: figures come from Harvard Gazette, Yale News, Brown University News and Dartmouth News admission announcements published on March 28, 2024, covering initial offers for the Class of 2028; rates are calculated from the reported counts and rounded to two decimal places. The overall row pools applications and offers across these four institutions, not the entire Ivy League, and cannot identify unique applicants or estimate an individual student’s chances.
What the source figures actually measure
These announcements describe admission offers, not the number of students who ultimately enrolled. An admitted student can choose another institution, and later waitlist activity can change the final admitted total.
The reporting point therefore matters. Compare initial-offer figures with initial-offer figures, rather than treating an announcement and a later institutional report as interchangeable.
The application totals also count submissions to each university. A student who applied to Harvard and Yale appears in both institutions’ applicant pools; adding those pools does not produce a count of distinct students.
Why the overall row is weighted
The 4.37% overall rate divides total offers by total applications. It does not simply average the four percentages, because the applicant pools differ in size.
Harvard received 54,008 applications, while Dartmouth received 31,657. An application-weighted calculation preserves that difference and describes the combined submission pool accurately. It remains a pool statistic, not a forecast for your college list.
How to use these benchmarks
Use the historical figures as a planning constraint in 2026, then make decisions using your academic record, intended field, application requirements and financial circumstances.
- Treat all four universities as reaches. Rates from 3.59% to 5.36% do not support calling any school in this table a dependable option, even for a strong applicant.
- Do not choose Brown over Harvard because of the percentage alone. The difference between 5.36% and 3.59% describes different applicant pools; it does not measure which institution fits your goals.
- Compare like with like. Keep the admission cohort, applicant category, reporting date and admission round consistent before interpreting a difference.
- Use the 4.37% pooled rate to challenge an overly narrow list. A list made entirely of similarly selective institutions needs additional options that fit both your academic profile and financial requirements.
What acceptance rates do well—and poorly
| Planning option | Best for | Strength | Limitation |
|---|---|---|---|
| School-level acceptance rate | Understanding institutional selectivity | Summarizes a published applicant pool | Does not assess your academic or personal fit |
| Pooled acceptance rate | Seeing the selectivity of this comparison | Accounts for different application volumes | Combines overlapping applicants and different institutions |
| Individual application review | Identifying preparation and presentation gaps | Connects your evidence to application choices | Cannot turn judgment into a guaranteed outcome |
| Academic and financial list review | Building a workable set of choices | Tests whether an offer would meet your needs | Requires more research than comparing percentages |
Read each school’s rate alongside its requirements
For a 2026 application, check the university’s official undergraduate admissions pages before choosing a testing plan or drafting responses. Record the applicable entry cycle, deadlines, required materials and any school-specific instructions.
A historical acceptance rate is not evidence of a current admissions requirement. Keep the benchmark sheet separate from your requirements checklist so an older statistic does not carry an older policy into your application plan.
Harvard: interpret the 3.59% rate correctly
Harvard’s 1,937 initial offers from 54,008 applications establish the lowest rate in this four-school comparison. They do not establish a minimum combination of grades, scores or activities that secures admission.
Your next step is a requirements audit: check the current testing instructions, school reports, recommendations and writing requirements directly with Harvard. Then identify which parts of your academic and extracurricular record need explanation rather than assuming impressive credentials speak for themselves.
Yale: distinguish selectivity from personal fit
Yale’s 2,146 initial offers from 57,465 applications produce a 3.73% rate. That figure describes the whole reported pool, not a separate benchmark for your curriculum, nationality or intended subject.
Before drafting, examine the academic opportunities that make Yale relevant to your interests. Your application preparation should connect those interests to sustained work you can describe accurately, not to the institution’s position in an acceptance-rate table.
Brown: do not mistake the highest rate for safety
Brown’s 2,623 initial offers from 48,898 applications produce a 5.36% rate. It is the highest percentage here, but the figure offers no basis for treating Brown as a reliable fallback.
Check Brown’s current application instructions and research how its academic structure matches the way you want to study. A persuasive reason to apply starts with that match, not with a comparatively larger percentage.
Dartmouth: investigate fit beyond the percentage
Dartmouth’s 1,685 initial offers from 31,657 applications produce a 5.32% rate. Its proximity to Brown’s 5.36% does not make the institutions interchangeable choices.
Review Dartmouth’s academic offerings, undergraduate experience and current application requirements separately. Keep the reasons you would attend distinct from the reasons you believe your application is competitive.
Turn the benchmarks into an application plan
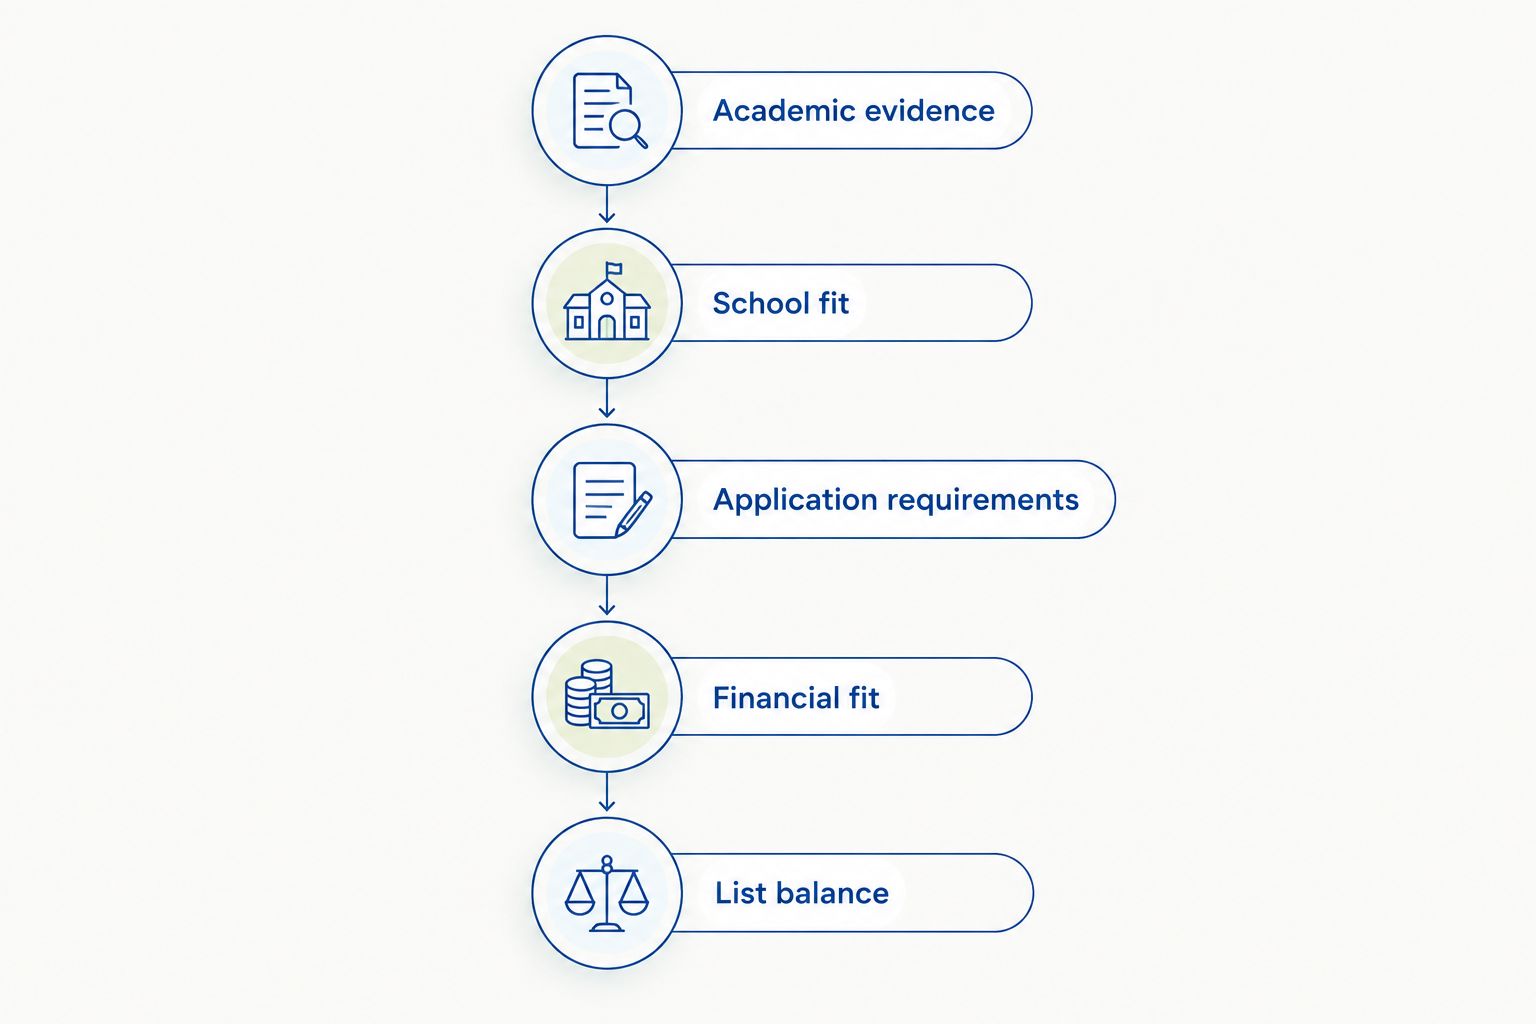
A useful planning process moves from evidence to choices, not from a preferred university name to a predicted probability. Keep the following sequence in your working document.
Academic evidence
Record your curriculum, subject choices, results and academic interests. Identify any gaps that need context, and distinguish completed achievements from work still in progress.
School fit
For each university, write a specific academic reason to apply. Check the relevant department or programme information rather than relying on reputation or a general subject ranking.
Application requirements
Create a separate checklist for each institution using official instructions. Include testing, written responses, recommendations and submission responsibilities without assuming every school asks for the same materials.
Financial fit
Discuss the family’s funding requirements before finalising the list. Check institutional aid eligibility, required financial documents and scholarship conditions directly with each university.
List balance
Review the complete list, not just its most selective names. Include institutions you would genuinely attend and assess whether the academic and financial choices remain workable if the reach applications are unsuccessful.
International applicants need a separate financial review
Families in India, the UAE, Singapore, the US and the UK should distinguish where the student lives from how each institution classifies the application. Check the university’s definitions and financial-aid instructions rather than assuming residency alone answers every eligibility question.
The 3.59%–5.36% range does not establish an international-applicant acceptance rate. It also does not show how requesting financial aid affects a particular application category.
For your 2026 plan, maintain separate notes for admission requirements and financial-aid requirements. An academically suitable university is not a complete option until you understand the funding conditions that apply to your family.
If you are considering both US and UK universities, keep separate application plans. Do not apply the pooled 4.37% US institutional rate to a UK course choice or treat the two systems as equivalent selection processes.
Where personalized counseling fits
Ivy Central’s personalized college admissions counseling is best for families seeking individual application strategy, not an admission guarantee. Caroline Linger and Jose Kumar work directly with each student, connecting college choices, application planning and essay guidance to that student’s circumstances.
The benefit is an individual review rather than an interpretation based only on a school-wide percentage. The limit is equally clear: counseling cannot control a university’s decisions or convert a historical rate into a personal probability.
For a consultation, bring your academic record, intended subjects, activities, preliminary university list and financial priorities to Ivy Central. Ask how Caroline Linger and Jose Kumar would address the specific decisions your family faces, including US-versus-UK choices where relevant.
FAQ
What are the Ivy League acceptance rate benchmarks for 2026?
For 2026 planning, this historical four-school comparison ranges from Harvard’s 3.59% to Brown’s 5.36%, with a pooled rate of 4.37%. The figures cover initial offers for the Class of 2028, not decisions issued in 2026 or the entire Ivy League.
Which school has the lowest acceptance rate in this comparison?
Harvard has the lowest rate in this comparison at 3.59%, based on 1,937 initial offers from 54,008 applications. The scope is the Class of 2028 announcement, not a current-cycle prediction.
Does Brown’s higher acceptance rate make it a safety school?
No. Brown’s 5.36% historical rate does not make it a safety school or establish your personal likelihood of admission. Assess academic fit and maintain a balanced university list.
Is 4.37% the average acceptance rate for the entire Ivy League?
No. The 4.37% figure pools applications and initial offers for Harvard, Yale, Brown and Dartmouth only. It is application-weighted and does not represent every Ivy League university.
Can I use the overall acceptance rate as an international student?
Use the overall rate to understand institutional selectivity, not as an international-applicant probability. The table does not separate applicants by citizenship, residence, curriculum or financial-aid request.
Are early admission rates directly comparable with these figures?
No. The table combines admission rounds, so an early-round percentage has a different scope. Comparing the percentages alone does not establish that applying early improves a particular student’s chances.
How can Ivy Central help with a highly selective university list?
Ivy Central provides personalized college admissions counseling, with Caroline Linger and Jose Kumar working directly with each student. Guidance can address university choices, application strategy and essays, but it does not guarantee admission.
One last thing
Do not multiply rejection percentages to calculate your chance of receiving at least one offer. That calculation would assume independent admission outcomes and personal probabilities that these school-level figures do not establish.
A better final check for 2026 is practical: if every reach university declines, does your remaining list still contain academic and financial options you would be pleased to accept? Answer that before adding another highly selective application.
Related guides
- Safety schools for Ivy League applicants
- Need-blind universities for international students
- Universities for computer science in the UK